Computing and Software
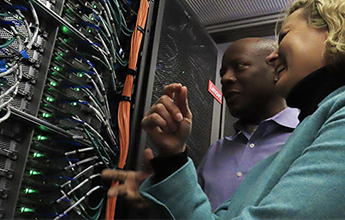
Access to high performance computing, research software, and global networks for conducting computationally intense research.
Research Computing and Data Services
Supporting faculty, student, and staff researchers by providing data science and visualization, computing, and data-management expertise
We provide campus researchers across all disciplines access to computing resources and consulting services to support innovative research.
Access to high performance computing, research software, and global networks for conducting computationally intense research.
Learn about data management planning and options for storing, securing, transferring, and sharing data.
Support for collecting, analyzing, visualizing, and programming with research data.
Identify events, resources, and people to help you learn computational and data skills for your research.
Research Computing and Data Services staff consults with Northwestern researchers across all disciplines and schools. Read more about our work in our research case studies.
Data Science, Statistics, and Visualization staff also collaborate directly with faculty researchers on active research projects. Learn more about project collaboration support.
Visit the Research Computing and Data Services resource site for updates, events, and links to learning resources.
Subscribe to the NUIT-RESEARCH listserv for information about research and training opportunities happening on and off campus.