2023-2024 Data Science, Statistics and Visualization Services Annual Report
During the 2023-2024 academic year, the Data Science, Statistics, and Visualization (DSSV) team within Northwestern IT Research Computing and Data Services supported the data science and visualization needs of Northwestern researchers in multiple ways:
- Workshops provide opportunities to learn new skills and explore tools and analysis methods via high-quality training at no or low cost to the researchers.
- Individual consultations help researchers troubleshoot issues, explore new analysis approaches, get assistance with data manipulation, interpret results, and create visualizations.
- Bring Your Own Data (BYOD) working groups support researchers undertaking data-intensive work by connecting them to DSSV staff and other researchers across the university for accountability and advice.
- Collaborative projects bring together DSSV staff’s specialized skills with faculty researchers from many different domains to undertake impactful research.
Workshops
The DSSV team offered virtual and in-person workshops on both the Evanston and Chicago campuses. An increase in staff size allowed us to teach more workshops than we did in previous years. We were also able to teach our popular summer boot camps on both campuses, where researchers spent multiple days learning introductory and intermediate R and Python skills.
In our Next Steps in R and Next Steps in Python series, we introduced many new advanced topics and launched our first AI workshops and our first statistical concepts workshops, which were taught outside of a specific coding language.
The four most popular workshops of FY24 were:
- How to Code with ChatGPT
- Statistical Modeling with Correlated Data
- Python Fundamentals Bootcamp
- RStudio Projects
Impact
- 70 percent increase in workshop hours offered
- 41 percent of workshop registrants were from the Feinberg School of Medicine—a steady rise since FY20, when it was 24 percent
- 32 percent of registrants from FY23 returned to register for one or more workshops in FY24
- 14 percent increase in the number of registrants attending one or more workshops
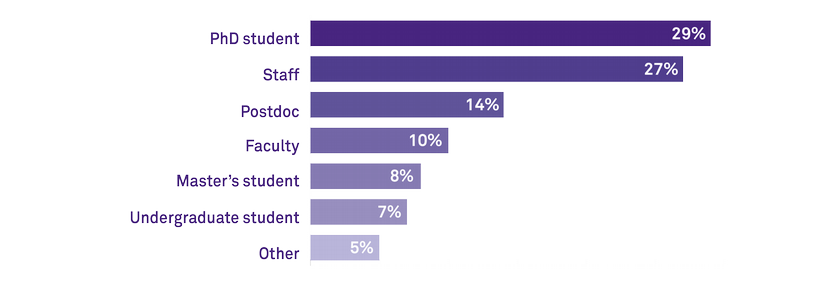
Role of Workshop Registrants
Consultations
We support researchers both through one-on-one research consultations and small Bring Your Own Data (BYOD) working groups that meet weekly over a quarter. FY24 saw the continued popularity of the genomics and visualization BYOD working groups and the introduction of a new social sciences BYOD working group.
Before FY24, our data scientists provided statistical support only where they were qualified and as availability allowed. In FY24, we welcomed two statisticians to the DSSV team which enabled us to increase statistical support as part of our consultation service. Reflecting the previously unmet need at the University, adding statistical support increased the number of consultations we completed and the number of researchers served.
Impact
- 62 percent increase in the number of statistical consultations achieved
- 23 percent increase in the number of researchers served in FY23
- 22 percent increase in the number of consultations achieved
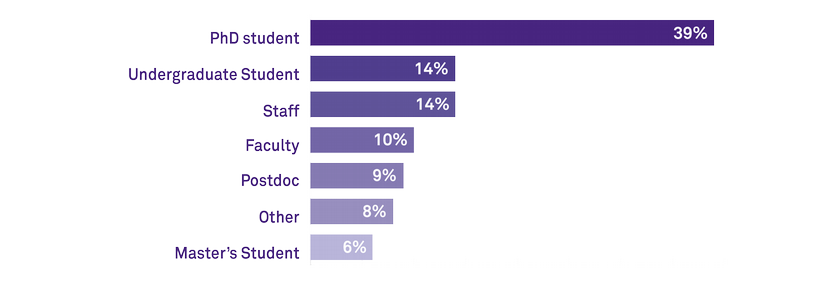
Role of Researchers Requesting Consultations
Collaborative Project Support
In addition to projects in data collection, analysis, and visualization, we assisted with grant proposal preparation and exploratory investigations to determine proof of concept, allowing us to assist faculty beginning at the earliest stages of a project. We also began incorporating LLM models into project workflows as appropriate and took on the development of our first AI research tool, with more to follow in FY25.
Project Highlights
The team continued several collaborations from previous years and started new ones. A few projects are highlighted below. You can read more about the DSSV team’s projects in the Project Portfolio.
RainFlow
A new software product, Rainflow, was published on the Apple App Store in partnership with Luis Amaral (McCormick). Rainflow provides a user-friendly interface to analyze flow cytometry data with an emphasis on reproducibility and data validation. RCDS staff coded the core algorithms used in the app, designed the software program flow, wrote the documentation, and created simulated data for testing and validation.
EpiPred
For Gemma Carvill (Feinberg), our team made significant improvements to the EpiPred web tool that allows families and researchers to explore predicted clinical outcomes of specific genetic variants related to epilepsy.
SSO-Protected Web Server
We began work building an SSO-protected web server for Sumit Dhar's (School of Communication) lab. The server will host multiple Shiny applications to explore clinical audiology data.
AI Simulation Tool
RCDS staff collaborated with Pritzker Law faculty Esther Barron, Stephen Reed, and colleagues in IT Media and Technology Innovation to develop and launch an AI simulation tool to train law students to communicate and work with entrepreneurs.
Police Use of Force
University staff and graduate student consultants provided data analysis, visualization, and methodological input for a recently published newspaper article by Kari Lydersen (Medill) and a cohort of Medill students on police use of force in response to mental health calls in a dozen large US cities.
Research Network Diagrams
Network diagrams to demonstrate the strength and type of connections across members of a research network were created for Thomas McDade (Weinberg) to enhance a grant proposal.
Student Consultation Program
Each year, talented graduate and undergraduate students at Northwestern apply to our highly competitive Student Data Science Consultant Program. Students come into the program with experience in data science, statistics, or visualization and develop their professional and advanced technical skills through hands-on work with other Northwestern researchers.
Data Science Student Consultants
- Flynn Chen, Medicine
- Tuba Dohlar, Mechanical Engineering
- Daniel Encinas Zevallos, Political Science
- Arne Holverscheid, Political Science
- Isabel Knight, Data Science Undergraduate
- Yangyang Li, Driskill Graduate Program in Life Sciences
- Jenny Liu, Medicine
- Julie Anh Nguyen, Applied Math
- Yaelle Pierre, Data Science Undergraduate
- Anthony Pulvino, Interdisciplinary Biological Sciences
- Carrie Stallings, Sociology
- Elizabeth Teng, Astronomy
- Daniel Turner, Linguistics
- Samvardhan Vishnoi, Physics
- Eileen Zheng Wu, Psychology
- Patrick Zacher, Cognitive Psychology
Staff
Team members and their positions during the 2023-2024 academic year:
- Christina Maimone: Associate Director, Research Data Services
- Colby Witherup Wood: Manager, Data Science Services
- David Nichols: Lead Statistician
- Aaron Geller: Senior Data Visualization Specialist
- efrén cruz cortés: Data Scientist
- Ritika Giri: Data Scientist
- John Lee: Data Scientist
- Emilio Lehoucq: Data Scientist
- Jillian Whitton: Statistician