2022-2023 Data Science, Statistics and Visualization Services Annual Report
During the 2022-2023 academic year, the Data Science, Statistics, and Visualization (DSSV) team within Northwestern IT Research Computing and Data Services supported the data science and visualization needs of Northwestern researchers in multiple ways:
- Individual consultations help researchers troubleshoot issues, explore new analysis approaches, get assistance with data manipulation, interpret results, and create visualizations.
- Workshops provide opportunities to learn new skills and explore tools and analysis methods via high-quality training at no cost to the researchers.
- Bring Your Own Data (BYOD) working groups support researchers undertaking data-intensive work by connecting them to DSSV staff and other researchers across the university for accountability and advice.
- Collaborative projects bring together DSSV staff’s specialized skills with researchers from many different domains to undertake impactful research.
Workshops
The DSSV team continued to offer virtual workshops throughout the academic year where researchers could participate synchronously or work through workshop materials and a recorded video later at their own pace. We were excited to return to an in-person format for our summer bootcamps where researchers spent multiple days learning introductory and intermediate R and Python skills on both the Evanston and Chicago campuses. The schedule included an expanded series of visualization topics across multiple languages and programs, covering Shiny, Plotly, Bokeh, Glue, matplotlib, ParaView, JavaScript, HTML and CSS basics, and an introduction to data visualization.
Workshops included customized sessions for Research Experiences for Undergraduates (REU) programs in CIERA and Quantitative Biology, and for research analysts from the Global Poverty Research Lab. We also worked with researchers in the Department of Preventive Medicine to facilitate discussion of ways to improve data visualizations.Consultations
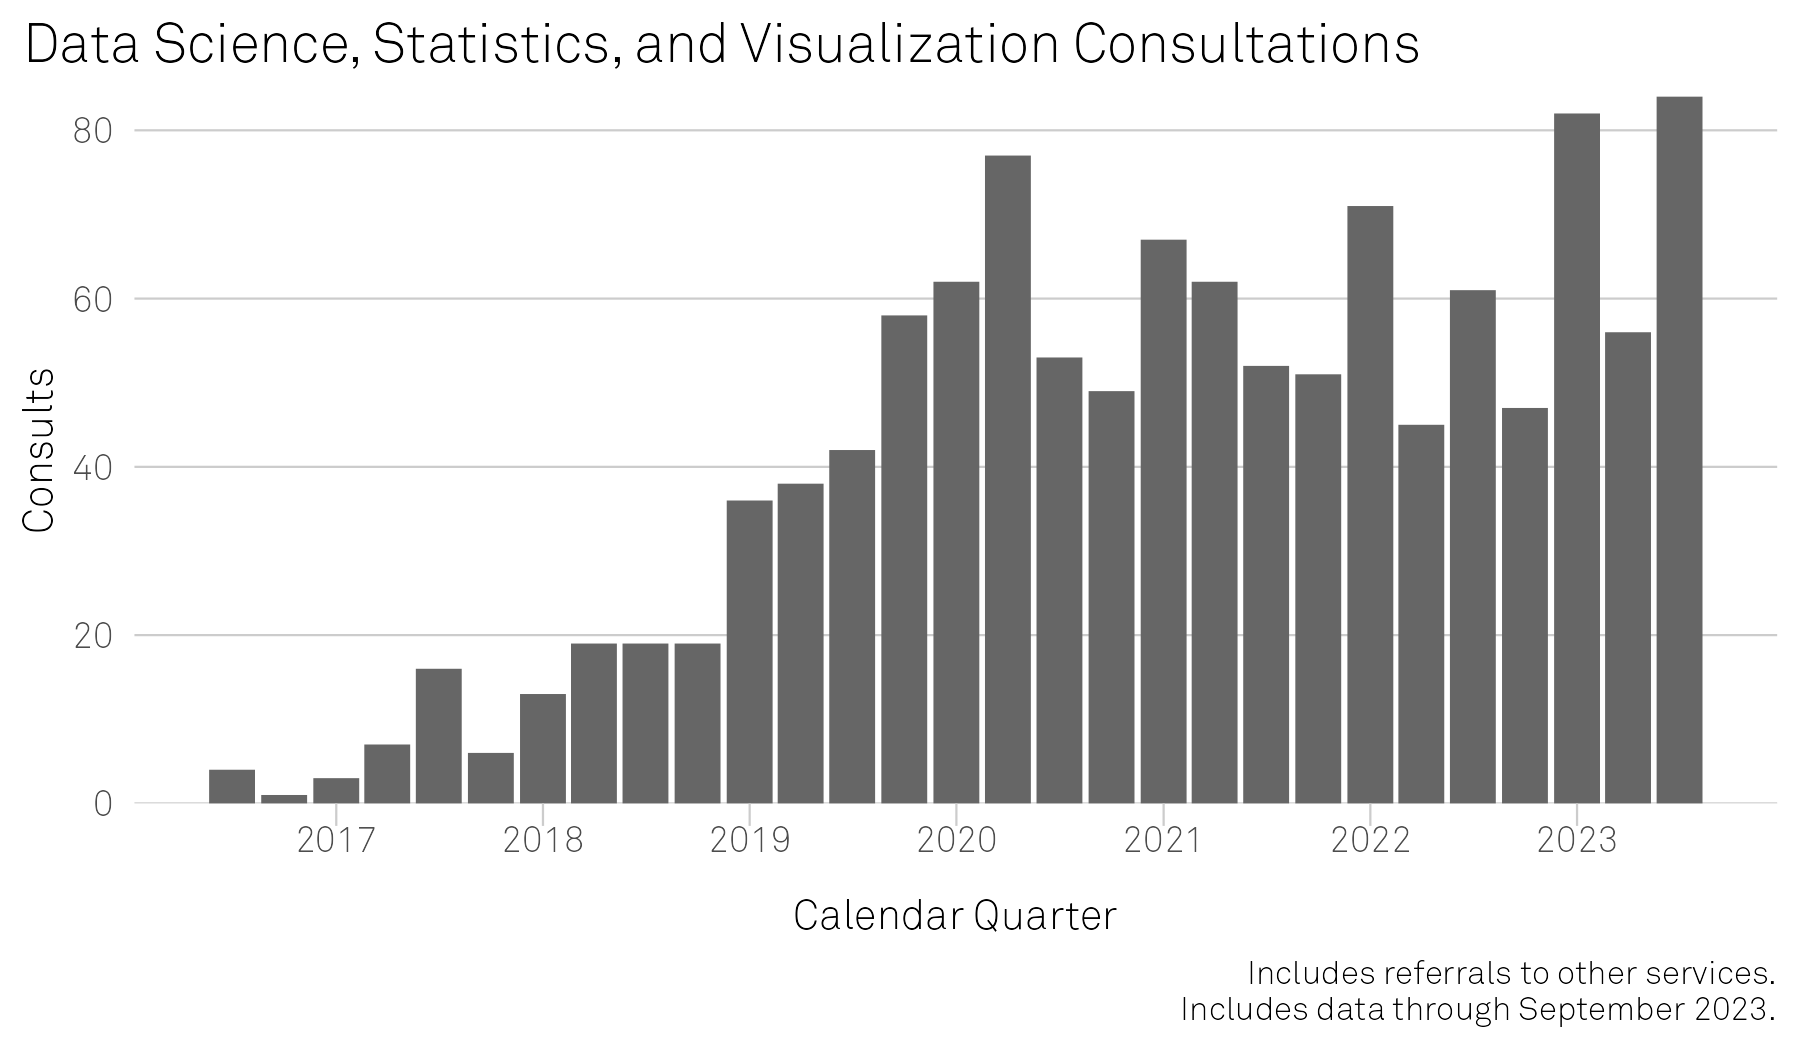
We support researchers both through one-on-one research consultations and through small, Bring Your Own Data (BYOD) working groups that meet weekly over a quarter. We saw an increase in
- 245 One-on-one consultations with researchers from 11 of Northwestern’s schools and the Northwestern Prison Education Program, a 14% increase over 2021-2022
- 42 BYOD working group participants across eight groups
Research Collaboration Highlights
The team continued several collaborations from previous years and started new ones. A few projects are highlighted below. You can read more about the DSSV team’s projects in the Project Portfolio.
RainFlow
Collaborating with the Amaral Lab to develop flow cytometry analysis software that supports a reproducible analysis workflow and uses a new clustering algorithm to improve data analysis across multiple samples.
Astrophysics Illustrations and Graphics
Created multiple graphics to accompany publications from CIERA researchers Claude-André Faucher-Giguère, Vicky Kalogera, Jillian Rastinejab, and Wen-fai Fong on galaxy evolution, the merging of black holes, and a kilonova.
FOIA Dashboard
A Data Science Student Consultant supported a research assistant for Jacqueline Stevens from Political Science in creating an interactive application to explore publicly available FOIA data.
Inclusive STEM Teaching Text Analysis
Explored natural language processing techniques to identify themes in over 200,000 short-answer survey responses about participants’ experiences in a professional development program for inclusive STEM teaching practices in a project with Bennett Goldberg.
Patient Symptom Tracking Visualizations
Generating a visualization of patients’ urological symptoms, both at the current clinic visit and over time, to aid in treatment decisions and evaluation of outcomes with James Griffith and his collaborators in the Feinberg School of Medicine.
External Impact
- US Research Software Engineer Association (US-RSE) Steering Committee
- CaRCC Professionalization Working Group Co-Chair
- PEARC23 Paper: “Compensation of Academic Research Computing and Data Professionals”
- Northwestern IT DEI Committee Steering Committee
- Supported the addition of the Visualization role to the CRediT scholarly output taxonomy
Team Members
Team members and their positions during the 2022-2023 academic year.
Staff
- Christina Maimone: Associate Director, Research Data Services
- Colby Witherup Wood: Lead Data Scientist
- Aaron Geller: Senior Data Visualization Specialist
- Ritika Giri: Data Scientist
Data Science Student Consultants
- Haley Carter, Plant Biology and Conservation
- Rahul Devathu, Neuroscience and Data Science
- Daniel Encinas Zevallos, Political Science
- Arne Holverscheid, Political Science
- Benjamin Liu, Math/Statistics/MMSS
- Ren Lopez, Materials Science and Engineering
- Julianne Murphy, Health Sciences Integrated Program
- Julie Anh Nguyen, Applied Math
- Jose Sotelo, Cognitive Psychology
- Carrie Stallings, Sociology
- Dan Turner, Linguistics
- Patrick Zacher, Cognitive Psychology
Social Justice News Nexus
A Data Science Student Consultant created matching algorithms to combine data on mental health calls to 911 and police arrests across multiple cities with Kari Lydersen from the Medill School of Journalism, Media, Integrated Marketing Communications.